Energy Planning Innovation & Enhanced Production™

EPI

EPI provides innovations for enhanced production in the subsurface energy industry that combine economic benefits and environmental sustainability.

Filtering by Tag: enhanced production

Changes in how project results are provided to the client.

EPI Question of the Month:

This Question-of-the-Month is about data delivery, data security, company policies and procedures, and most of all, making information available for its intended use as quickly as possible.

As the last step in the chain, what do managing all of these require to move testing & analysis results to productive applications, particularly in the current environment of big data?

Sherri Heroux, Data Management Specialist and former EPI Affiliate replies:

 
CC Image So much data.

 Final report writing or analysis formatting is the last step to move test data and analysis to a commercial product. Based on many years of experience, this step is often taken for granted.  It’s frequently just assumed that the data from tests and analyses get to a commercial product; but indeed, it doesn’t “just happen.”  Recently, the emphasis on big data draws attention to the essential step of making data available in a user-friendly easily retrieval manner.

Geo-related data (lithology, mechanical/physical properties, in-situ stress, formation pressure etc)  range from processed analog information from sensors that are converted to digital form, to qualitative observations of phenomena.  Reliable information starts with the processing of sensor signals and requires careful archiving including provenance, calibrations, upsets, and procedures for generating and acquiring those data. That’s why input from the entire team is involved in this last step. “Bridging” between the test and analysis engineers and scientists and the end user clients is required.  Quality control, data confidentiality, delivery schedules were always critical, and are even more so in the era of “big data.”

Over my experience of three decades managing and presenting geo-related data has evolved substantially. Initially, hard copy reports were prepared with appended analog presentations of data. Occasionally, an analyst made visual picks from charts. The data were usually summarized in a tabular form to emphasize key or anomalous behavior. We moved from this age of the IBM typewriter to prototype and progressively more sophisticated spreadsheets and word processing. This evolution offered improved hard copy reports and greatly facilitated rudimentary interpretive activities. Sharing and transmission of data was still laborious requiring mainly hard copies. Bandwidth was low; encryption was very basic and generally unnecessary, and transfer protocols were painful.

Lengthy data in flat files can now be provided to a client online, in color, and as 3D diagrams.

Lengthy data in flat files can now be provided to a client online, in color, and as 3D diagrams.

With time, electronic delivery of data developed, led by parallel developments of electronic transfer capabilities. Cost constraints favored transfer of tabulated information in flat files, with relational databases used only to a restricted extent. The transfer of data in this form, with implications for multi-million dollar financial decisions, caused quality assurance and data delivery security to become prime considerations.

What is the next frontier? Possibly the re-use of past data. As an example, miles and miles of rock core test data exist from past decades. That information may be available electronically, but not in a user-friendly and easily retrievable form.  The bulk of these data has likely been underutilized if utilized at all. The volume of such data and the expenditures that would be required have precluded previous interpretation or even trend assessments. However, advanced computational capabilities using AI and machine learning are now aiming at using such data for modern oil/gas play developments, enhanced recovery assessments, and for vetting investment opportunities.

The opportunities for future data utilization are unfathomable. But, it’s still all about making information available as quickly as possible. That’s what “big data” is all about. What goes around, comes around...

Sherri has extensive experience reporting and presenting rock data and analysis to end users. This requires bridging between engineers & scientists and end users while considering quality control, data management, technical writing, budget considerations, data confidentiality, delivery schedules, and other issues. For additional discussion she can be reached at sheroux @ epirecovery.com


Similar rock, different lab, different results. Why?

EPI Question of the Month:

Jim, you are certainly an expert on laboratory triaxial rock testing, with many years of experience including assisting many rock mechanics laboratories and rock mechanics test data users, what do you think --even after decades of laboratory testing-- are the biggest reasons why there are considerable differences in the apparent rock properties measured by different laboratories?

REPLY from Jim Marquardt, EPI Affiliate


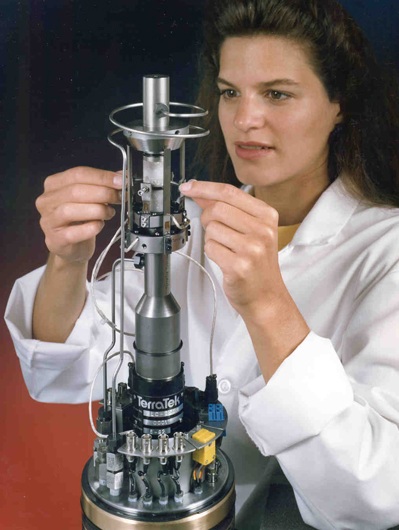
In my experience with a number of rock testing laboratories, indeed I do see considerable variations in the rock properties measured on similar rocks.  The variations are not just rock variability, but tend to be either test problems and/or interpretation problems.  Strength, shear stiffness and bulk compressibility, and ultra-sonic velocities all at varying confining pressures are among the most common properties measured. Measuring these properties under deep earth conditions is challenging. As one of my colleagues used to say, “if it was easy, everyone would do it”!

Jim Marquardt with triaxial test equipment.

Jim Marquardt with triaxial test equipment.

One of the challenges is that rocks vary greatly in strength and stiffness, ranging from unconsolidated sandstones from the deep waters of the Gulf of Mexico, to quartzites encountered in the mining industry, to the all-important shale plays in North America. The first step for measuring properties over this broad range is proper testing system setup and calibration.  For example, the range of the load cell and deformation measuring gages is critical.  One would not want to use a fifty-thousand pound (50k lbf) load cell when measuring the strength of a 500 psi weak sandstone.  Load at failure on a one-inch diameter sample would only be 1% of load-cell capacity.

Equally important is calibration of the instrumentation. One would not want to use a two hundred fifty thousand pound (250k lbf) class “A” instrument to calibrate the 50k lbf load cell noted above. Typically, third party calibration labs will provide a “10-point calibration”. Therefore by using the 250k lbf instrument to calibrate the 50k lbf load cell, only three data points would be utilized, 0, 25,000 and 50,000 pounds. It goes without saying that using that 50k lbf load cell calibrated with a 250k lbf instrument, for testing the weak sandstone noted above, is almost no calibration--yet I sometimes see this.

Measuring rock deformations is more difficult than measuring loads, and may be the source of the largest machine and interpretation problems.  The entire "specimen stack" deforms under pressure and load, therefore requiring separating the sample deformation from the entire specimen stack deformation.  This leads to Pressure Effect Corrections ("PE’s") and to Load Effect Corrections ("LE’s"). PE’s and LE’s are parameters that are typically directly measured on a standard material with known properties--such as aluminum, and applied either by hand or in the test computer software.     

This is not easy, and to complicate matters, very small rock deformations can be involved, for example in measuring pore compressibility. The stiffer the rock and the smaller the sample, the more important these corrections become. And making things more difficult, PE's required for the deformation measuring transducers (inside the high-pressure environment) are not perfect.  Transducer calibration tests can be made using a material with known properties (as noted above).  But unfortunately, the small deformation of metals under pressure does not "exercise" the transducers to the extent as when deformations are made on the specimen stack.  I have had experience with both strain-gauged cantilevers and with LVDT's for measuring the rock deformation. Each has its advantage and its limitations.  Overall, rock testing laboratories must be equipped with a wide range of transducers and calibration instruments. 

Specimen stack instrumentation.

Specimen stack instrumentation.

Another area where I have seen errors has to do with the specimen stack and the test computer software aimed to "automatically" take into account the specimen stack, the rock, and the transducers.  Since many things affect PE's and LE's, it is critical to maintain a compatible specimen stack, transducer, and test software.  I have seen outright errors where something has changed in the setup (like changing transducers, changing endcaps, a repair on a strain gage, or even a different electrical connection) but no change has been made in the PE's or LE’s.  Indeed, if these corrections are not properly determined and applied, incorrect apparent properties like Young's modulus, Poisson’s ratio, and bulk compressibility will be reported.

Finally, sample preparation, construction of the specimen stack, and test machine setup are critical.  Proper techniques for all are difficult, and require trained individuals.  Parallel sample ends, parallel specimen stack metal parts, and parallel machine alignment are required.  The overall handling of the sample and placement of transducers are major aspects to be considered. Samples with voids or inclusions or fractures pose special problems as the analysis assumes that samples are statically determinant and that deformation is homogeneous throughout the sample.  CT x-ray scans are very valuable to evaluate the quality of the sample prior to and after testing.

In conclusion, testing procedures and analysis of the recorded data determine the properties that are reported. I have seen cases of basic test procedure errors that lead to incorrect apparent properties.  In other cases I have seen correct procedures but incorrect analysis of the recorded data.  Specimen jacketing, endcap and spacer optimization, sample handling including moisture and temperature conditions, strain gage behavior, pre-loading of samples, and more.... are all details that lead to test scatter or to repeatable results. Experience teaches us that the details are critical! Thoughts anyone??


Innovations for clean, abundant, low-cost and reliable energy.

hello@epirecovery.com

Salt Lake City, Utah, USA

©2016-2024 EPI all rights reserved